Our Team
At CalPERS, diversity is one of our greatest strengths and we embrace our diverse workforce.
We rely on team member demographic data to inform the organization of its workforce race, ethnicity, generational, gender, veteran, and persons with disabilities profile.
We also encourage team members to participate in the Statewide Change in Disability Status Survey and Statewide Employee Veteran Survey.
There are limitations to this data. For example, it's a snapshot in time and change is constant. Additionally, team members may find the available identification choices don't align with the way they self-identify.
Gender by Position
Gender at CalPERS by Class Group
This table presents the percentage of men and women, by class group, for the fiscal year 2022 to 2023.
| Position | Women | Men |
|---|---|---|
| Executive | 45.45% | 54.55% |
| Division Leader | 44.12% | 55.88% |
| Section Leader | 56.37% | 43.63% |
| Team Leader | 57.46% | 42.54% |
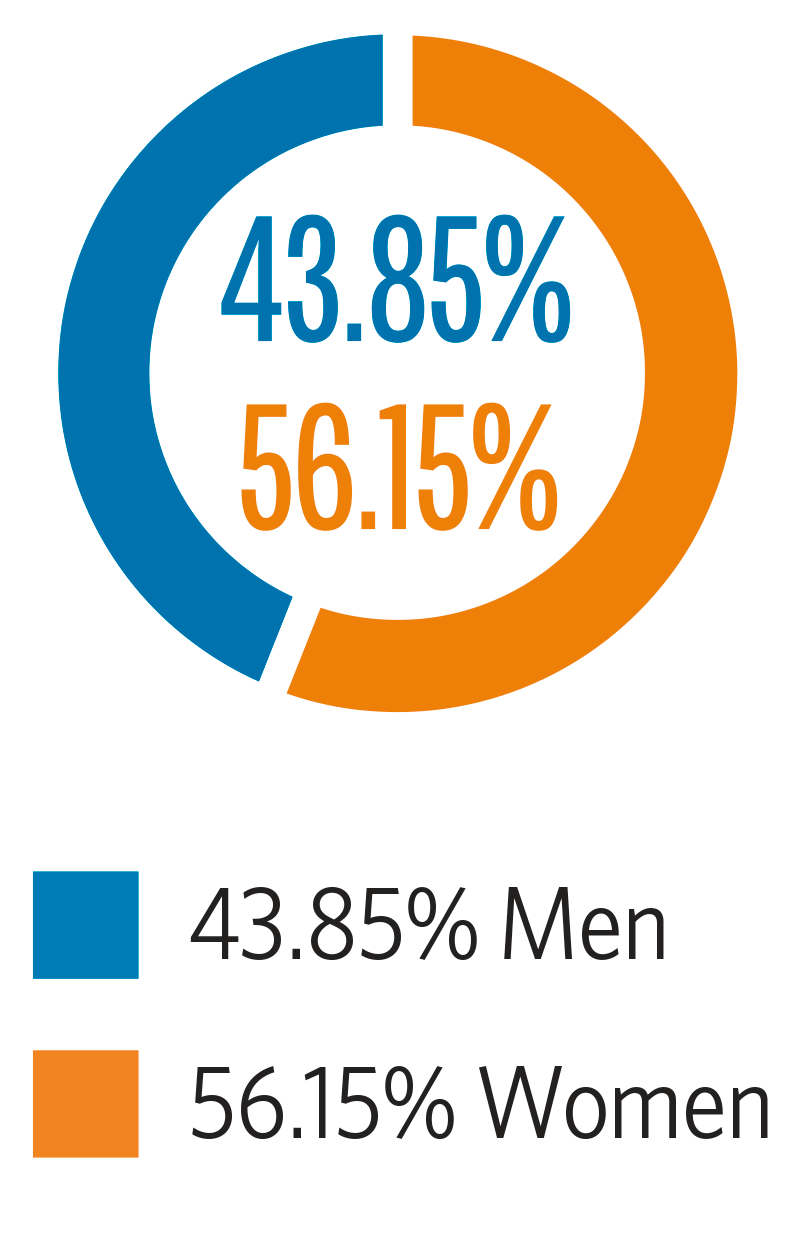
| Team Member | 56.16% | 43.84% |
Generational Diversity
This table presents the percentage of CalPERS team members, grouped by what generation they fall into, for the fiscal year 2022 to 2023.
| Generation | Percentage |
|---|---|
| Generation Z (born 1997 – 2015) | 1.90% |
| Millennials (born 1982 – 1996) | 39.68% |
| Generation X (born 1965 – 1981) | 47.11% |
| Baby Boomers (born 1946 – 1964) | 11.27% |
| Traditionalists (born 1925 – 1945) | 0.04% |
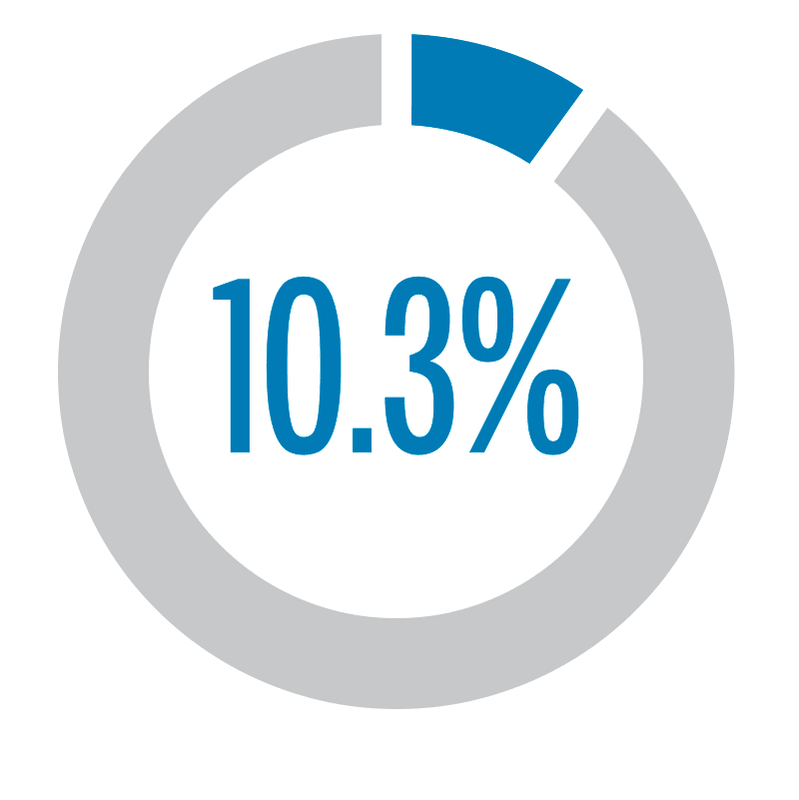
Our Team Members With Disabilities
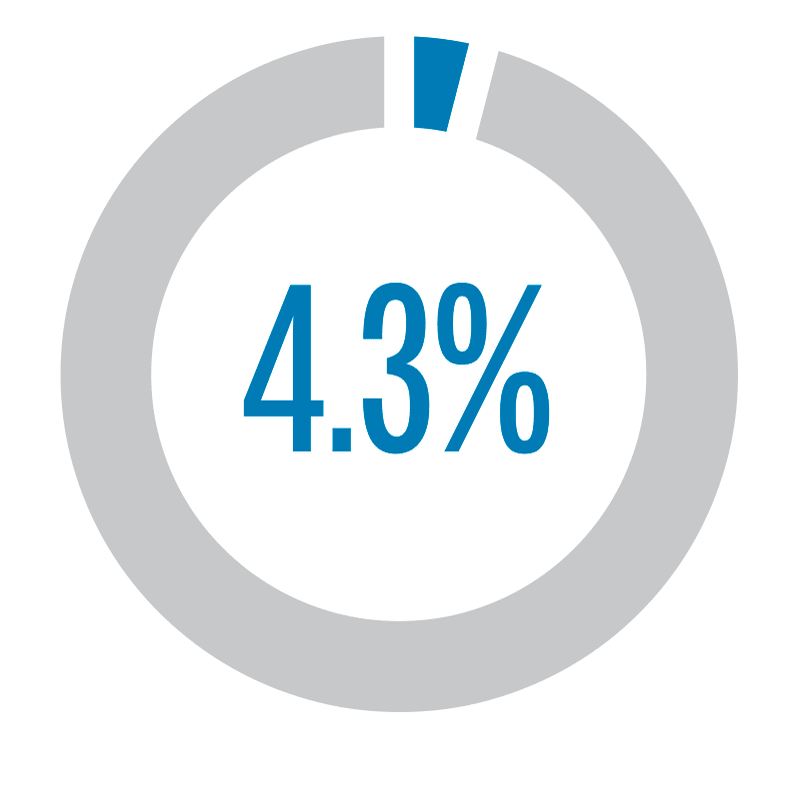
Our Team Members Who Are Veterans
Race & Ethnicity*
This table presents the percentage of CalPERS team members, grouped by their race and ethnicity, for the fiscal year 2022 to 2023.
| Race-Ethnicity | Percentage |
|---|---|
| Asian-Cambodian | 0.08% |
| Asian-Chinese | 8.26% |
| Asian-Filipino | 4.29% |
| Asian-Indian | 4.21% |
| Asian-Japanese | 1.94% |
| Asian-Korean | 0.58% |
| Asian-Laotian | 0.29% |
| Asian-Other or Multiple | 4.50% |
| Asian-Vietnamese | 4.17% |
| Black or African American | 7.51% |
| Hispanic or Latino | 16.64% |
| Multiple Race | 3.26% |
| Native American or Alaskan Native | 0.37% |
| Other | 0.70% |
| Pacific Islander-Guamanian | 0.17% |
| Pacific Islander-Hawaiian | 0.12% |
| Pacific Islander-Other or Multiple | 0.78% |
| White | 42.11% |
*Percentages are rounded and may not add up to 100%