Economic Impacts of CalPERS Pensions in California, FY 2022-23
California Benefit Payment Data FY 2022-23; 2022 Economic Data
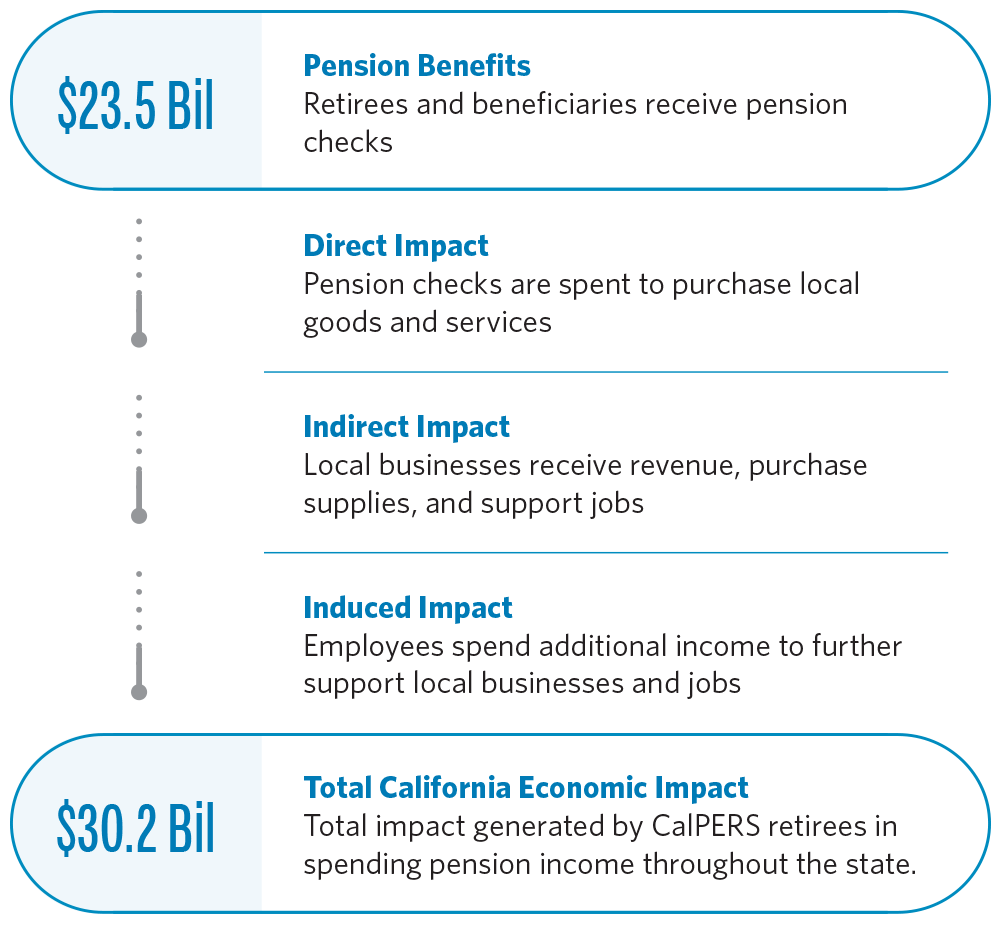
Every month, $1.95 billion in pension checks are sent to retirees and beneficiaries 1 that help fuel the California economy. Pensions not only sustain daily lives, but also contribute to the state’s economic strength.
Pensions are a steady source of income and don’t waver with the ups and downs of financial markets. In turn, when retirees spend their pension checks, they provide a constant stream of revenue to California.
This report looks back at the economic conditions in 2022 and offers estimates for some of how retiree pension benefits supported the California economy. More details about the methodology can be found at the end of the report.
| Highlighted Value | Economic Impact |
|---|---|
| $30.2 billion | Generated in CA economic activity |
| 139,188 | Supported jobs |
| $1.4 billion | Added tax revenue generated for local industries |
| $23.5 billion | Pension payments paid to CA retirees & beneficiaries ($31.1 billion in payments to all retirees & beneficiaries) |
| $36,685 | Annual average CalPERS pension in CA |
| 81.3% (641,804) | Retirees & beneficiaries live in CA |
A Steady Stream of Income for California’s Economy
The Economic Impact of Pensions Continues to Grow
Over the course of two years, the economic impact of CalPERS pension spending in the state increased by more than $2.5 billion, reaching a total of $30.2 billion in 2022.
As the fifth largest economy globally, this growth was paralleled by a 19% increase in California’s gross domestic product (GDP) to $3.64 trillion in 2022. The GDP is one way to measure the state’s economic health and output over a specific period. Together, this economic upswing and CalPERS pension spending supported significant benefits including:
- 140,000 jobs in various sectors across the state.
- $1.4 billion in tax revenue boosting essential public services and infrastructure.
- Growth to local California communities with the biggest impact in smaller ones.
Pensions are more than just a retirement plan; they signify retirees' financial well-being and foster a thriving economy, especially in smaller communities.
| Highlighted Value | Economic Impact |
|---|---|
| $3.64 trillion | CA GDP 2 |
| 39 million | Total CA population 2 |
| $93,278 | CA GDP per capita 2 |
| 3.9% | Unemployment rate 3 |
| $85,400 | Average CA salary 4 |
California Remains the Favorite Choice for Retirees
California continues to be home for most CalPERS retirees and beneficiaries. More than 81% of CalPERS retirees live in the Golden State, keeping over 75% of the annual pension payments inside state borders. The remaining retirees live primarily in neighboring states and less than 1% live internationally.
| Highlighted Value | Pension Fact |
|---|---|
| 789,016 | All retirees & beneficiaries |
| 641,804 | California retirees & beneficiaries |
| 81.3% | % Retirees & beneficiaries live in CA |
| $31.1 billion | Annual pension payments |
| $23.5 billion | Pension payments to CA retirees & beneficiaries |
| 75.5% | % Payments stay in CA |
Pensions Play Vital Role Supporting 140,000 California Jobs
Not only was California’s GDP making steady gains, but the unemployment rate decreased from 8.9% in 2020 to 3.9% in 2022, which also resulted in higher salaries as employers were trying to hire. Therefore, the estimated number of jobs that pensions supported saw a relative decrease as the economic recovery after the COVID-19 pandemic outpaced growth in CalPERS pensions. Despite this, the top five job sectors mostly experienced revenue growth, contributing over $1 billion more to the state’s economy in 2022 compared to 2020.
Top 5 Job Sectors 5
- Health & Social Services: This sector continued to be a significant contributor to the economy, emphasizing its essential role during challenging times.
- Retail Trade: Retail has faced a decline in jobs since 2020, but revenue increased, possibly influenced by shifts in consumer behavior and e-commerce trends.
- Accommodations and Food Services: As the economy recovered from the pandemic, retirees began traveling, dining, and using hospitality services leading to an increase in revenue. This was the only sector of the top five that added jobs supported.
- Other services 6: This category showed growth in revenue, but a decrease in jobs from 2020.
- Finance & Insurance: Economic changes and volatile financial markets likely influenced this mixed trend with a decrease in both revenue and jobs over two years.


Pensions Boost Local and State Tax Revenue
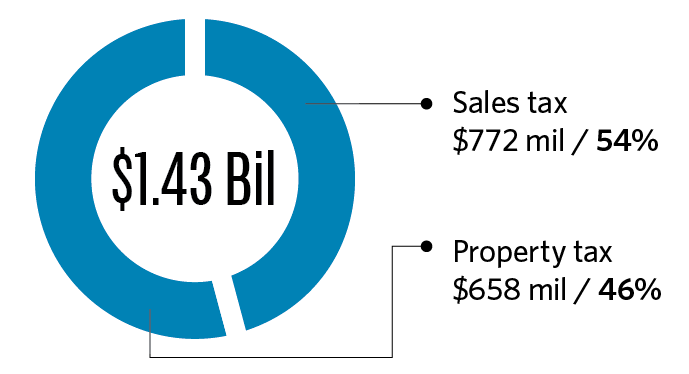
CalPERS retirees’ spending influenced significant tax revenue, which in turn supported both state and local governments. Specifically, 54% of this revenue came from sales taxes, while 46% was generated from property taxes.
- $772 million - sales tax revenue: When retirees purchase goods and services, it generates sales tax revenue for the local economy. Sales taxes support local public services and infrastructure that directly benefits the community.
- $658 million - property tax revenue: Retirees who pay for housing contribute to the local economy through property taxes. These annual tax payments support various community services such as schools, parks, and public safety.
Pension Spending Impacts on Local Economies
When retirees and beneficiaries purchase goods and services, their spending generates revenue and supports the local economy. As the economy recovered from the challenges of the COVID-19 pandemic in 2020, each of the top five counties in the state told a different story of how they fared from the revenue generated by CalPERS pension payments.
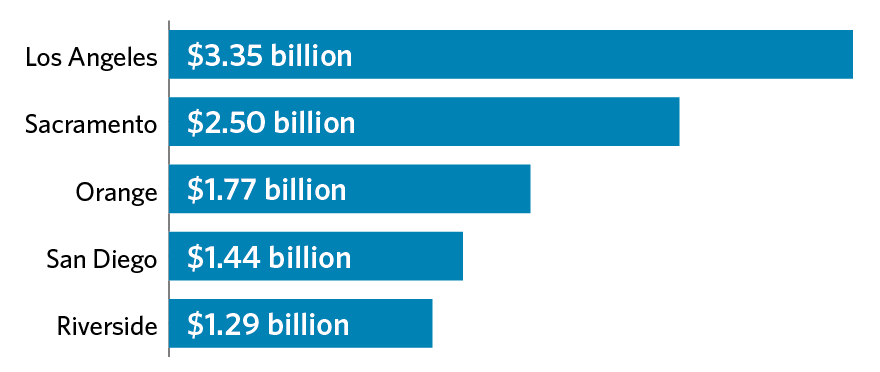
Among the top five counties, Los Angeles County had the largest economic impact from pension benefit spending, while the other four counties showed slight declines in revenue and job growth compared to the 2020 analysis. This is attributable to the fact that these local economies experienced strong economic growth in 2020 (up to 23% increase in gross regional product) that outpaced the growth in pension payments and spending. All five counties represent 43% of the total benefit recipient population and total pension payments in California.
- Los Angeles County: The county continued to hold the top spot over a two-year period as having the largest economic impact from pension benefit spending at $3.35 billion supporting 16,512 jobs. This is a 15% increase from 2020 with $2.92 billion in revenue generated and a 3% increase in jobs supported from 15,978. This can largely be attributed to the reopening of the “accommodations and food services” and the “arts-entertainment and recreation” job sectors.
- Sacramento County: In 2020, revenue grew to $2.75 billion, sustaining 15,545 jobs, but both revenue and employment declined in 2022 to $2.50 billion in revenue with 13,261 jobs supported.
- Orange County: In 2020, revenue stood at $1.81 billion, supporting 9,935 jobs. In 2022, revenue decreased by a modest 2% to $1.77 billion with a decline of jobs supported to 9,067.
- San Diego County: The county-maintained stability in revenue around $1.44 billion over the two-year span, however jobs supported declined by 7% from 8,279 to 7,716.
- Riverside County: The county generated $1.43 billion in revenue in 2020, supporting 9,204 jobs. By 2022, revenue dropped to $1.29 billion, while jobs supported fell by 14% to 7,960.
Making Significant Impacts in Small Communities
In counties where the gross regional product (GRP) is high or where there are a significant number of retirees, the economic impact from CalPERS pensions is usually large in absolute terms (dollar value). However, in counties where the GRP is smaller relative to CalPERS pension benefits, a greater economic impact is seen. This is because the pension payments represent a larger share of the local economy in those counties. Balancing the influences of retiree population size and GRP on local economic impact is perhaps best seen by examining the weighted economic impact (WEI).
WEI measures the regional economic impact per benefit recipient relative to the GRP measured per capita. Although Los Angeles County has a large GRP, some counties with smaller GRPs, such as Riverside and Shasta, have a significantly greater WEI due to the size of the population and pension payments. The WEI allows for a leveled comparison of economic impact across all counties by adjusting for the GRP and population size of each county.
A higher WEI suggests the benefit recipients’ economic impact more closely aligns with the per capita economic activity of the whole population. A region that has a WEI of 0.50, for example, indicates that the average warrant recipient’s contribution to GRP is half the GRP per capita of the region.
| County | Size of Local Economy (GRP, Billions) | Pension Spending Impact (WEI) |
|---|---|---|
| Los Angeles | $909.1 | 0.42 |
| Sacramento | $114.5 | 0.54 |
| Riverside | $109.5 | 0.65 |
| Fresno | $59.1 | 0.49 |
| Placer | $32.0 | 0.52 |
| Santa Cruz | $17.6 | 0.53 |
| Butte | $11.2 | 0.50 |
| Shasta | $9.9 | 0.54 |
| El Dorado | $9.6 | 0.53 |
| Sutter | $4.7 | 0.51 |
| Del Norte | $0.97 | 0.49 |
Data & Methodology
This report reviewed the impact of California benefit payments using CalPERS benefit data for fiscal year (FY) 2022-23 and 2022 calendar year economic data.
The data used for this study come from two sources: CalPERS retirement data and IMPLAN economic data. Economic data includes sources such as the U.S. Bureau of Economic Analysis, U.S. Department of Agriculture, U.S. Bureau of Labor Statistics, and the U.S. Census Bureau. The retirement data includes annual gross allowances for pension benefit recipients who resided in California as of June 30, 2023. The population examined in this study includes California benefit recipients from CalPERS.
This study measures the economic impacts of our benefit payments using IMPLAN, an input-output modeling software that measures the regional or local effects given one or multiple changes in economic activity. The study utilizes Household Income Events to model a change in household income from pension payments, isolated from industry production and payroll. IMPLAN is widely used by governments, universities, and private sector organizations to assess the economic impacts in many industry sectors.
Footnotes
1In this report, "retiree" refers to anyone receiving a regular recurring pension check from CalPERS (retirees, beneficiaries, and survivors).
2Source: U.S. Bureau of Economic Analysis
3Source: U.S. Bureau of Labor Statistics
4Source: U.S. Bureau of Economic Analysis; average salary data calculated using the quotient of "Wages and salaries by place of work (thousands of dollars)" (from table SAINC7N) and "Wage and salary employment" (from table SAEMP25N)
5IMPLAN uses North American Industry Classification System (NAICS) codes for industry and job sector definitions. Job sectors are multiple industries grouped together. For example, industries in the health and social services job sector include hospitals, offices of physicians, residential mental health, substance abuse, and other facilities. More information about IMPLAN is available in the Data and Methodology section.
6The other services sector consists of these subsectors: repair and maintenance, personal and laundry services, religious, grant making, civic, professional, and similar organizations, and private households.